


DATA HARVESTING
THE USE OF MULTIPLE, COMBINED MAPPING TECHNOLOGIES IS A COMPLEX FIELD
BY SARAH HOFFMANN
Farmers know that soils and crops exhibit variability. From Alberta’s first soil surveys in the 1920s to today’s vegetation and soil electrical conductivity maps, the mapping of these variations has influenced how farmers manage the multitudinous factors that affect crop yield.
Remote sensing technology as a means to collect data not visible to the human eye is on the rise in agriculture. Satellites began mapping vegetation in the 1970s using near-infrared wavelengths. Advances in technology propelled agricultural mapping from yield potential to actual yield through on-combine yield monitors in the 1990s. Farmers and agronomists are increasingly turning to manned aircraft equipped with various sensors as well as fixed-wing and rotor drones to assist them with crop scouting and the creation of prescription maps.
Infrared plus thermal mapping can determine when it’s time to move cattle from one pasture to the next, while vegetation maps can reduce chemical bills by informing in-season application decisions. Mapping can also determine variances in weed pressure, allowing farmers to spray in accordance with prevalence, and it can locate inefficiencies in irrigation systems by detecting increases in plant temperature.
Farmers and their consultants now combine these and other mapping technologies to create layers of data, with the goal of maximizing return on investment.
GROUNDED ADVICE
While vegetation, thermal and yield maps display information about above-ground plant life, soil scientists and imaging service providers focus on mapping what is at or beneath ground level.
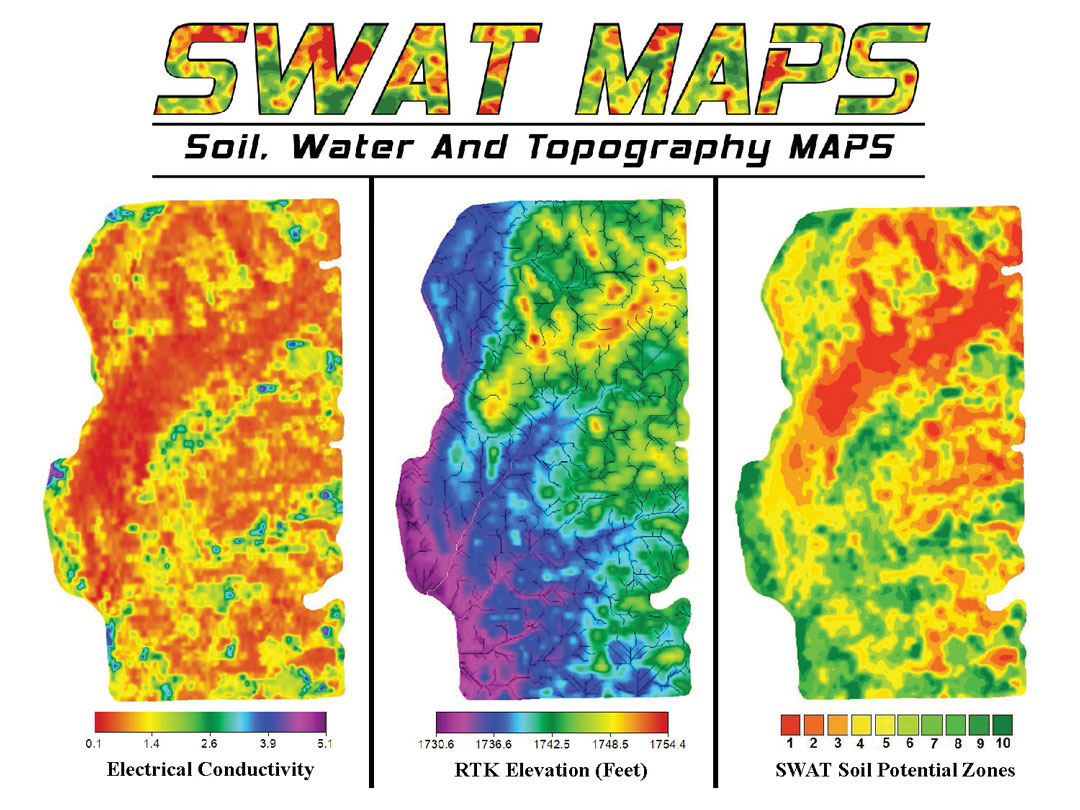
Cory Willness of CropPro Consulting in Naicam, SK, uses soil electrical conductivity, topography, water flow maps, organic matter and old-fashioned soil sampling to create prescription fertilizer and seed maps for his farm clients. While many companies build input recommendation prescriptions based on yield monitor data and vegetation maps, Willness believes soil, water and topography maps are the most reliable tools for guiding input decisions.
Willness noted yield maps generally prescribe the same fertilizer treatment to all areas with similar yield but do not take into account the reasons for yield variations. “You can have low-yielding areas because of flooding, and in another area it might be because it’s sandy or it has bugs or disease. So you run a real risk of making assumptions that all low-yielding areas shouldn’t be fertilized.”
Soil electrical conductivity (EC) maps are generated by towing a sled-mounted sensor over the entire field and measuring the conductivity of the soil to a depth of 1.2 metres. Sensor readings are affected by moisture, texture and dissolved solutes. The equipment also records elevation changes across the field.
High EC ratings don’t necessarily correspond with high soil potential; in fact, Willness noted the highest yield potential is in the middle ratings. Soils with high moisture or clay content tend to conduct more electricity, but so do soils with high salt content that tend to be in saline areas.
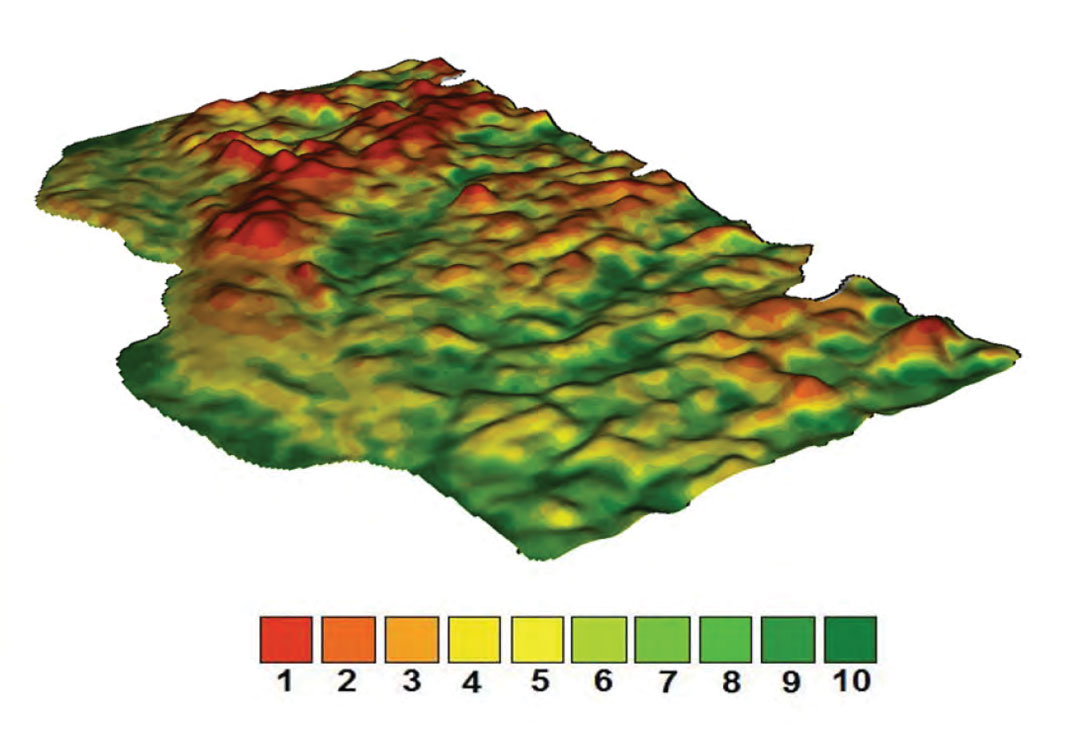
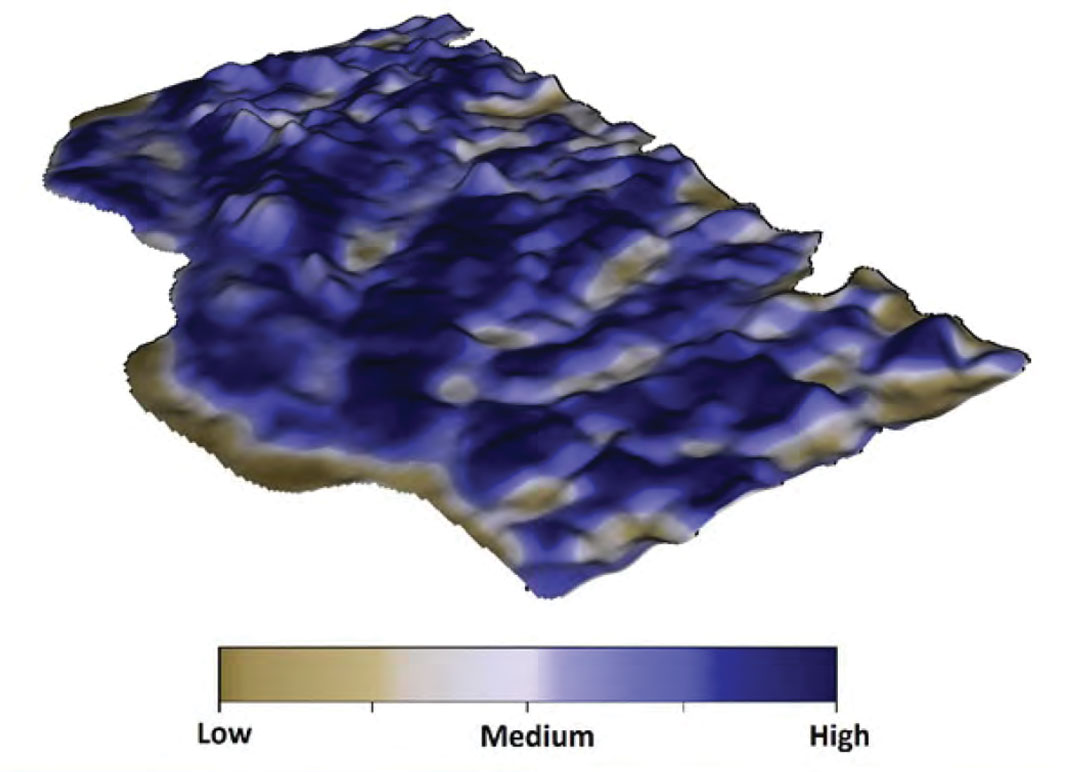
To effectively manage areas with varied EC ratings, Willness ground-truths his data by soil testing, talking to the farmer to understand the way the land has performed historically and getting a visual understanding of the depressions, mid-slopes and knolls of the field. He combines this data to create a prescription map, noting areas of the field that will be more or less responsive to nutrient inputs.
“Let’s say you test a field and the tops of hills are low in phosphorus and sulphur and the depressions are the opposite,” said Willness. “The fact that it’s a wet, average or dry year does not change the fact the depressions are not the most responsive to phosphorus and sulphur, so you could just put a maintenance rate on there.”
DATA DECISIONS
Marrying soil and vegetation data is a challenge for farmers and agronomists alike. The sheer quantity of data that can be collected is daunting, not to mention the various ways it can be interpreted, quantified and layered. Working in the Edmonton and Peace regions, Nuffield scholar and agronomist Kristina Polziehn uses aerial mapping combined with her on-the-ground experience. Her company, Axiom Agronomy, provides standard services such as soil sampling and crop scouting as well as aerial imagery from drones and manned aircraft.
She cited a lack of reliable data as the main challenge to the utilization of mapping by farmers. Ideally, this data should be gathered over a long time frame and include properly assigned causes for the variations in the images and information.
“People say you need 10 years of good data,” said Polziehn. But while there are decades of satellite imagery available, she noted that for most of that time, there’s been no one in the fields determining why variations exist. “Were those a result of disease? Surface disturbance? Bush removal?
“If you’re using data in order to build a layer into a yield map and it is bad data, you might not be ahead in putting that in,” said Polziehn. “Doing a little bit of historical ground-truthing and utilizing quality data is important.”
Polziehn said that widespread on-farm adoption of remote sensing and the maps it produces is fairly low, and for good reasons. For example, creating prescription fertilizer maps and uploading them to seeding equipment can be time consuming and the process varies from one brand of equipment to another. On large farms with multiple operators, it can be difficult to train everyone and make sure variable-rate application is always engaged. As well, analyzing data is time consuming.
“Even myself, I have access to so much data, but even if I had a satellite image come in every second day, would I be looking at that email? Probably not.”
While she continues her research into the world of remote sensing and farmers continue to work toward applying the data effectively on their farms, it’s important to remember that no map is a silver bullet. “Remote sensing is not a stand-alone technology,” said Polziehn. “It’s to be combined with other pieces of information. It’s maybe going to take time to figure out where it layers in.”
Kristina Polziehn’s Nuffield Scholarship is supported by the Alberta Wheat Commission.


Comments